Chart "Magic"
Some Novel Tools for Data Visualization
A rather quick talk by Seph Coster / @sephcoster
Data Visualization is Awesome.
- All kinds of ways to do it
- Allows you to see new things / trends
- Makes large sets more easily accessible
- Lots of data to work with
- OOoooh... pretty!
...But we can make it better with a couple tools.
Alright, so you need to make a chart?

Easy(er) Route:
Get your static data into a chart
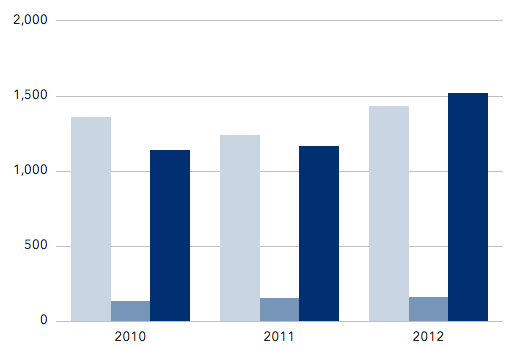
- Plenty of ways to do this (Excel Screenshot in a pinch)
- Allows viewers to see basic relationships
Hard(er) Route:
Provide users with filters
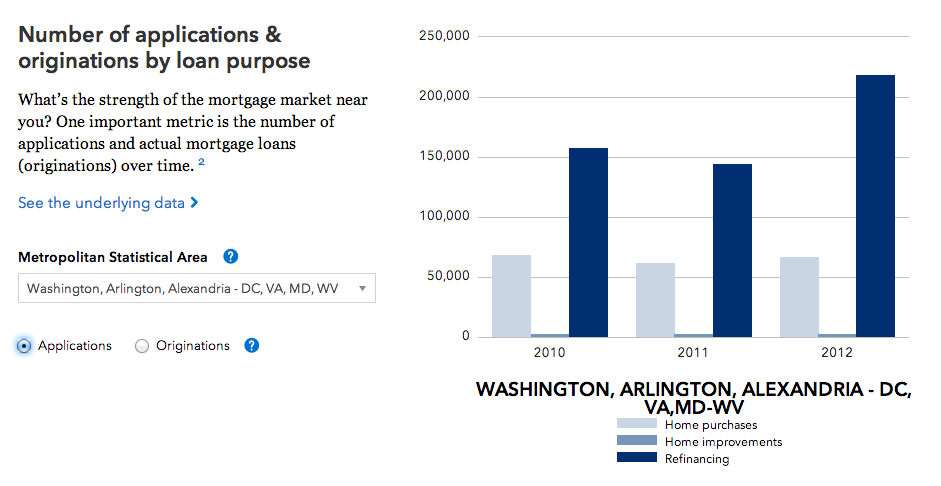
- Makes your views "dynamic"
- Typically uses static filters
- Great if you think you know what users already want
- Doesn't always handle large data well
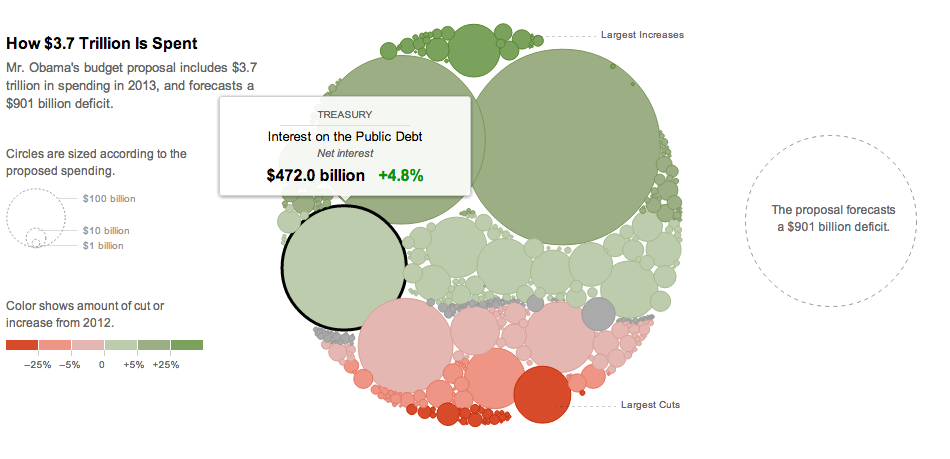
Sisyphean-sounding Route:
Multiple, dynamic filters across charts
- User-defined criteria and filters
- Apply filters across charts
- Handles lots of data quickly
- Customizable with good APIs
- IE-9 compatible? COME ON (though may require a shim)
I'm gonna need a bigger coffee mug...
Enter Crossfilter + D3.JS
D3.js
- "Data-driven Documents" written by Mike Bostock
- Extremely Powerful SVG / DOM manipulation
- Very customizable
- API takes some time to grok
Crossfilter
- Extremely fast, coordinated views
- Written by the good people at Square (and Mike Bostock)
- Multivariate, large datasets in the browser
- Uses sorted indexes and magic
- Client-side map / reduce with typed arrays
These two APIs + magic =
Dimensional Charting.JS (dc.js)
- Bridges D3 and Crossfilter APIs
- Includes preconfigured charts
- Allows full access to D3/Crossfilter APIs
- Makes both D3 and Crossfilter EASIER to use.
An Example with Public USAID Data:
How hard is that to build?
1) Get your data:
d3.csv("data/foreignAssistance.csv", function (data) {
	data.forEach(function (d) {
    d.amount = +d.amount; // cast to numbers
});
2) Add it to crossfilter and then create a "Group"
	var facts = crossfilter(data);
	var totalGroup = facts.groupAll()
		.reduceSum(dc.pluck("amount"));
3) Create a "dimension" of your data
var appropriationTypeDim = facts.dimension(dc.pluck('appropriationType'));
4) Create a "reduction" of your data (sum, average, etc)
var appropriationTypeGroupSum = appropriationTypeDim.group()
	.reduceSum(dc.pluck("amount"));
5) Create a chart
    var pie = dc.pieChart("#dc-chart-appropriationType")
        .dimension(appropriationTypeDim)
        .group(appropriationTypeGroupSum)
        .width(200)
        .height(200)
        .radius(80)
        .ordinalColors(appropriationTypeColors);
6) Rinse / Repeat with the same Group and different Dimensions / Reductions